After installation, simply trail the following easy steps to configure the Debugger.
Step 1: Open WSDebugger.exe located generally in SAPgui folder (“C:\\Program Files (x86)\SAP\FrontEnd\SAPgui”) . The interface of Debugger appears as below screen.

Step 2: Open guixt.sjs file to verify and edit directory 1 statement/ instruction is pointing towards scripts folder and set debug value to 1.
directory1 = 'C:\\LiquidUI\\Scripts';
debug=1;
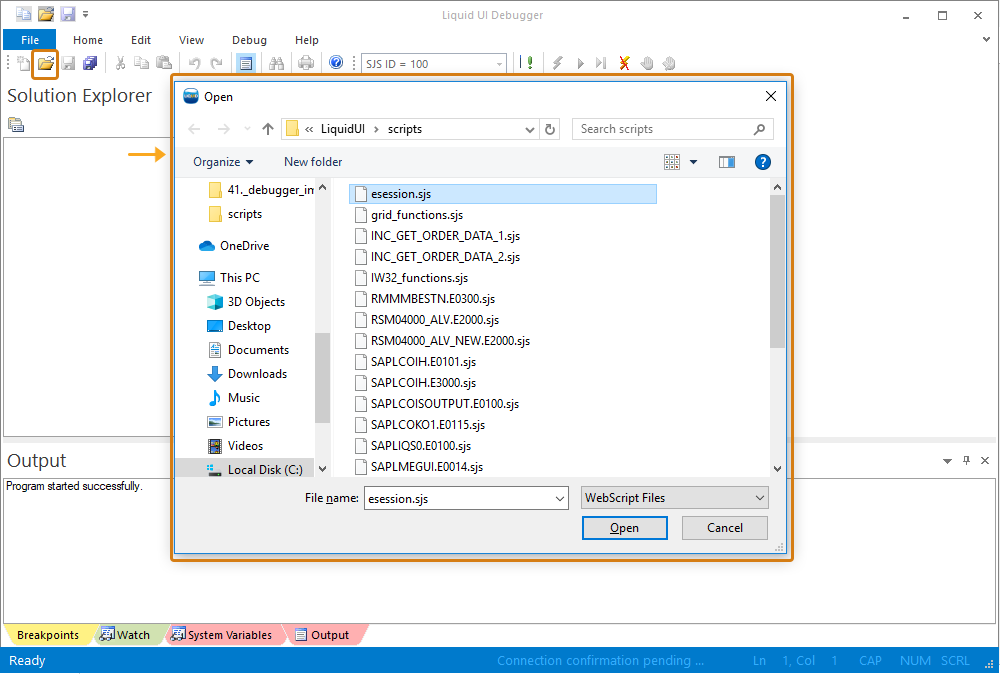
Step 3: Click the file icon located in the Main menu bar of WSDebugger to open the files in the directory defined in the guixt.sjs file.
Step 4: Open SAP GUI and make sure that "Activate GuiXT" is selected to run scripts.
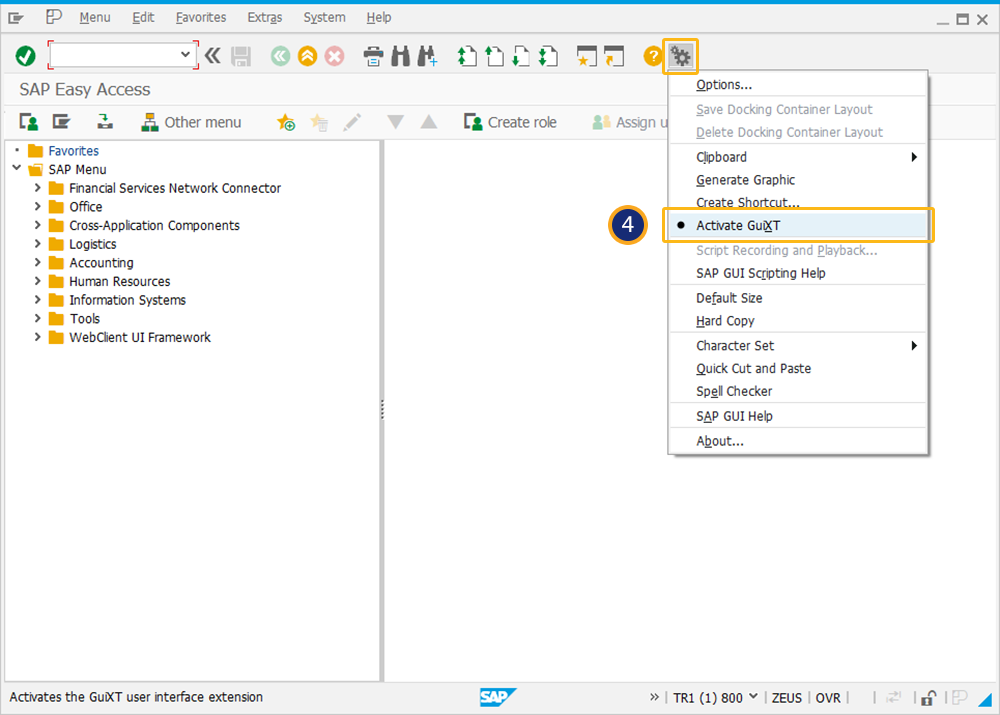
Note: The Location of the directory or path may vary depending on the OS.
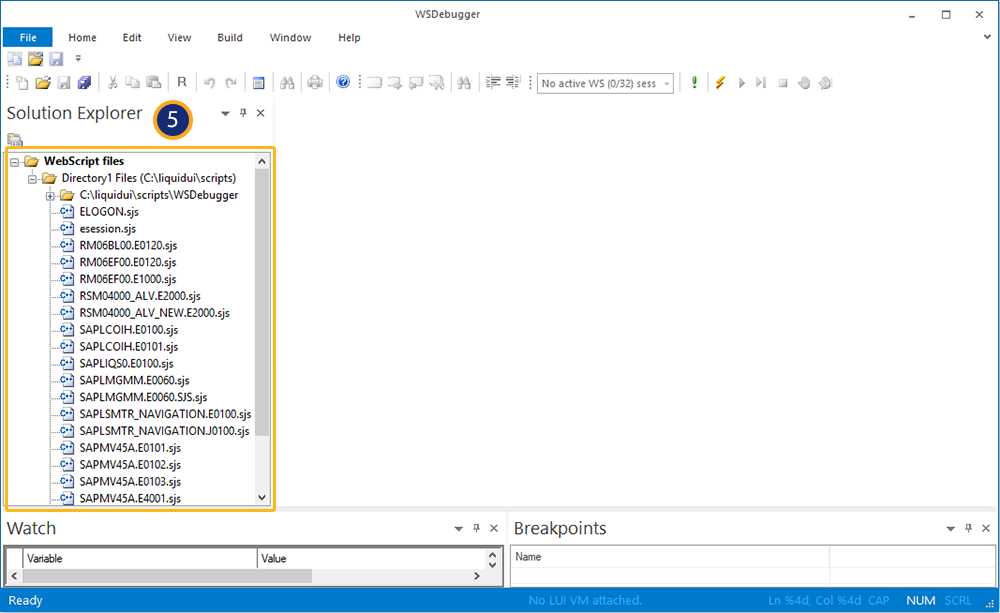
Step 5: You can view the scripts loaded into Solution Explorer of the WSDebugger from the script directory specified in guixt.sjs file.
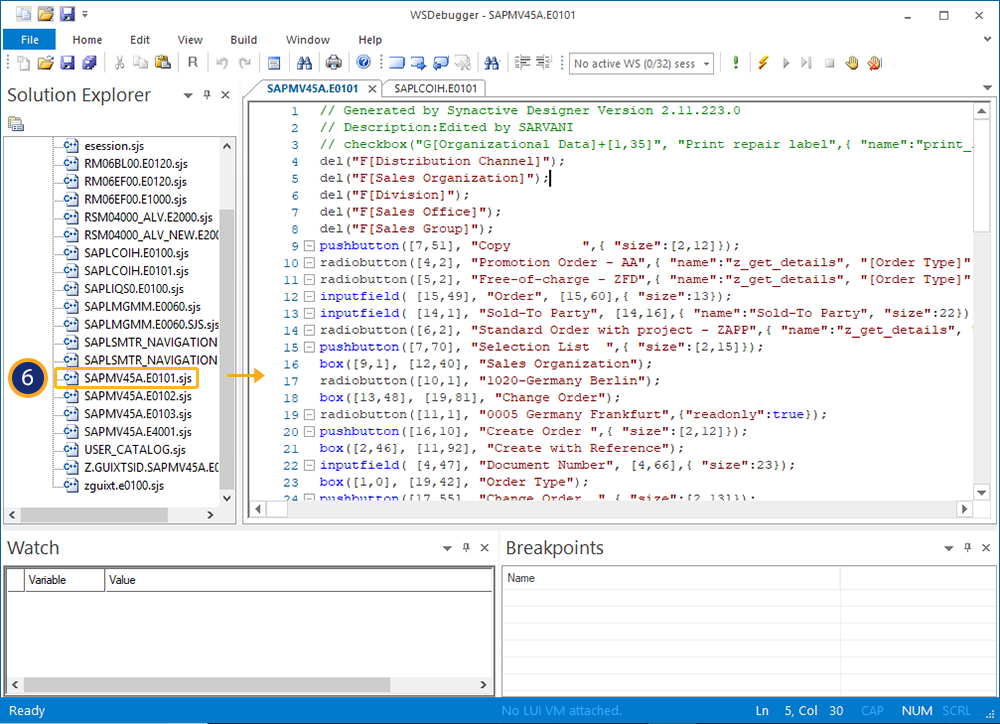
Step 6: Double click on the filename to open the script in the editor for the debugging process.