Prerequisites
- Products: Liquid UI WS, Liquid UI Server or Local DLL, Client Software
- Commands: del(), pushbutton(), title(), table(), column().
Purpose
This article shows how to display object data (e.g., in JSON format) directly in a Liquid UI Table on the SAP Easy Access screen. The following actions help visualize structured data like event logs, device info, and analytics directly in the SAP interface.
- Delete the image container from the SAP Easy Access screen.
- Add a push button to execute the process.
- Modify the screen title.
- Insert a table with the necessary columns.
- Add text to show the total number of events.
- Populate the Liquid UI Table with event data.
- Implement a function to extract and display event data.
User Interface
//Create the file SAPLSMTR_NAVIGATION.E0100.sjs inside your scripts folder for customizing the SAP Easy Access screen
//Now, add the Liquid UI script to the above file and save it.
Customization
- Delete the image container on the SAP Easy Access screen using del().
//Deletes the image container on the SAP screen
del("X[IMAGE_CONTAINER]");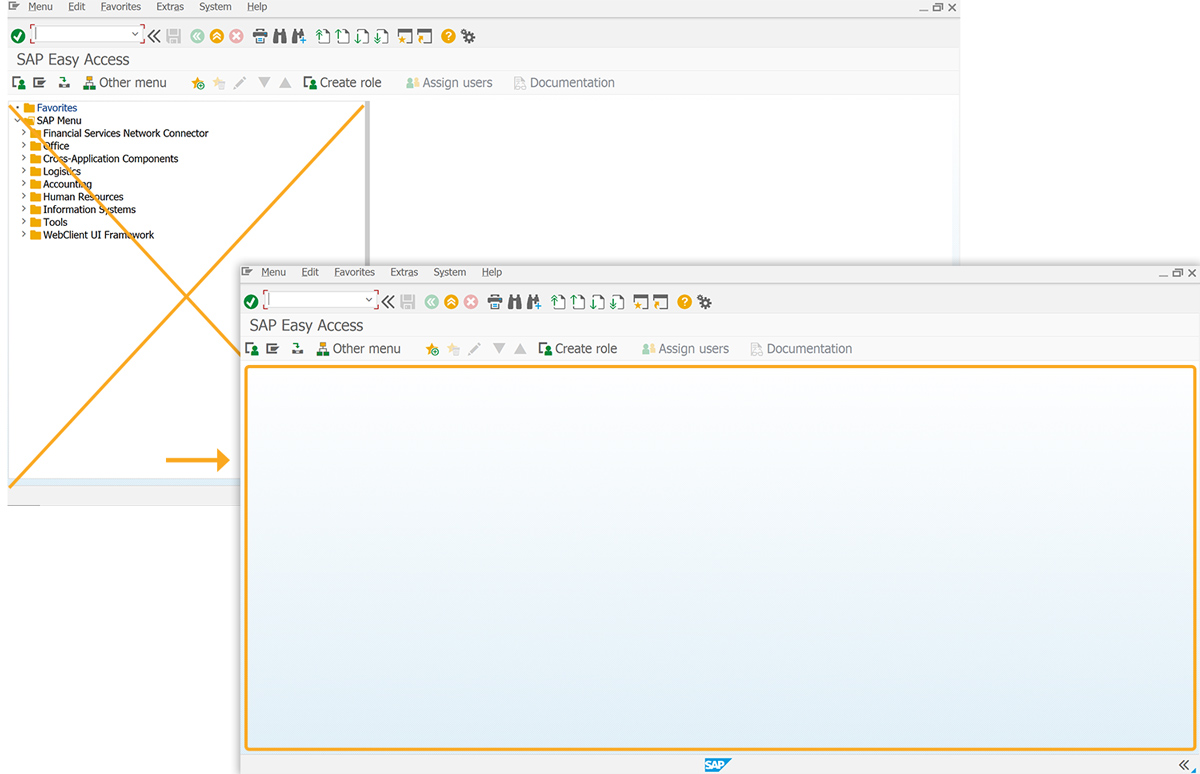
- Add a push button labeled Get Event Data to execute the GetEventData process on click.
// Creates a push button to execute the process
pushbutton([TOOLBAR],"@6S@Get Event Data","?",{"process":GetEventData});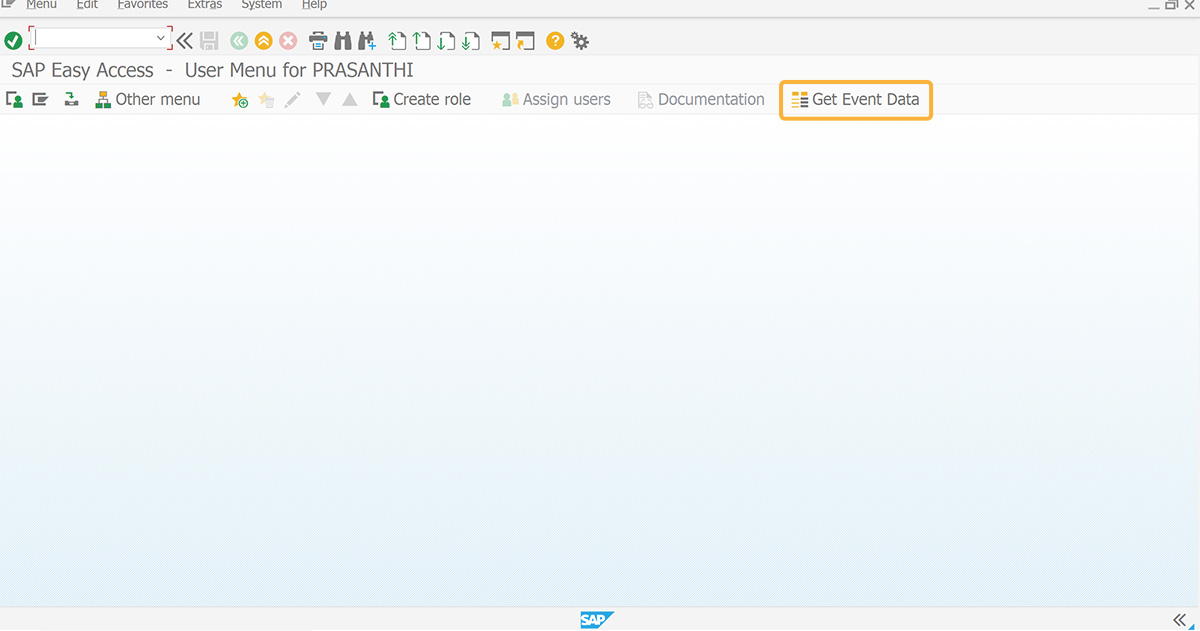
- Modify the screen title to Event Data - Screen Modified using Liquid UI.
// Adds a title
title("Event Data - Screen Modified using Liquid UI");
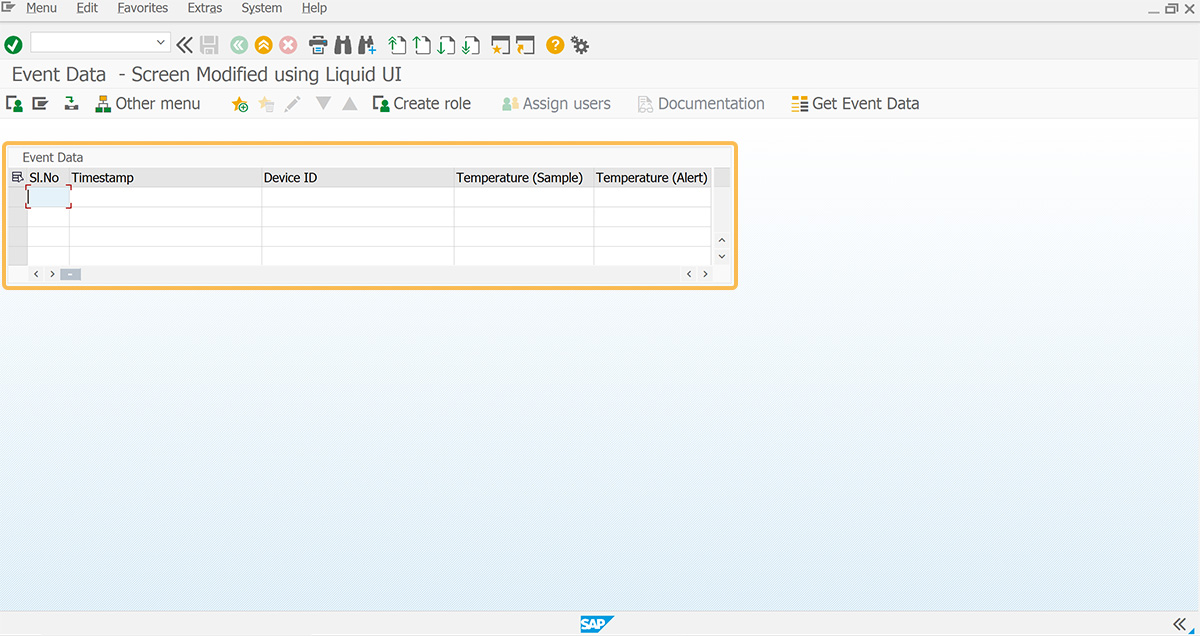
- Add a table named Event Data with columns for the event info, like in the image below.
// Creates a new table with the appropriate number of rows based on results length
table([1, 1], [4, 96], { "name": "event_table", "title": "Event Data", "rows":totalRows,"rowselection":true,"columnselection":true});
// Adds columns to the table
column("Sl.No", { "size": 5, "name": "slno_column" });
column("Timestamp", { "size": 25, "name": "timestamp_column" });
column("Device ID", { "size": 25, "name": "deviceid_column" });
column("Temperature (Sample)", { "size": 18, "name": "temperature_column" });
column("Temperature (Alert)", { "size": 15, "name": "alert_column" });
- Add a text Total Count to display the total event count.
// Creates text to display the number of events
text([8,1],"Total Count: &V[totalRows]");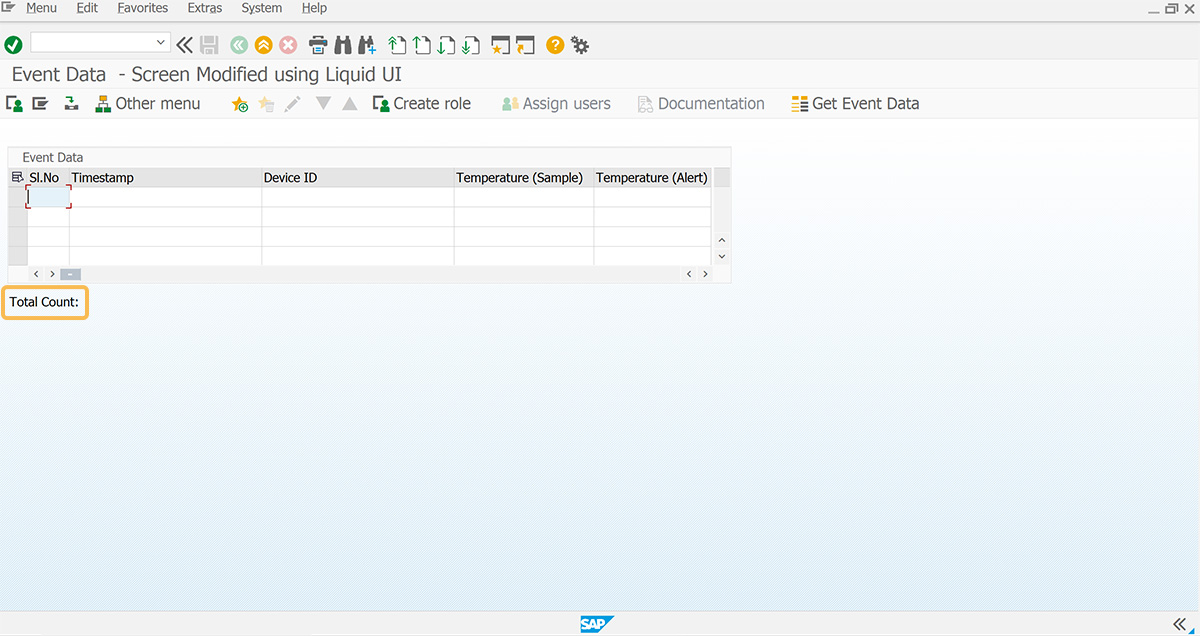
- Populate the Liquid UI table with extracted data.
// Populates the Liquid UI table with the extracted data for(var j=0;j<totalRows;j++){ event_table.slno_column[j] = Eventdata[j][0]; event_table.timestamp_column[j] = Eventdata[j][1]; event_table.deviceid_column[j] = Eventdata[j][2]; event_table.temperature_column[j] = Eventdata[j][3]; event_table.alert_column[j] = Eventdata[j][4]; - Add the GetEventData function to define the event data and process results.
// Function to define the event data and process the result
function GetEventData(){
   var objTaskEventList = {
    "results": [
        {
            "type": "beacon",
            "event": {
                "id": "a308c3f0-bf50-4180-a315-6f5f91a5decc",
                "timestamp": "2024-10-25T15:39:21Z",
                "deviceId": "59b0e8c2-87c4-4109-9b4c-bead14ed1f97",
                "data": {
                    "format": "beacon",
                    "id": "DLN233301440",
                    "rssi": -46,
                    "value": "17.59"
                }
            },
            "analytics": {
                "tenant": "f9339f76a7f1143dc30f587a46e09a6e",
                "recordedTimestamp": "2024-10-25T15:39:37.618Z",
                "resourceId": "db8597cd-6176-415c-bff4-90583a77f9a6",
                "timestamp": "2024-10-25T15:39:21Z",
                "meta": {
                    "data": {
                        "taskId": "3aabc8ea-00f1-4780-9256-817f024d0bd3",
                        "task_alarm": false,
                        "notes": "",
                        "assetIds": []
                    }
                },
                "coordinates": {
                    "global": {
                        "lat": 37.522003,
                        "lng": -121.953835
                    }
                }
            },
            "decode": {
                "temperature": {
                    "sample": 17.59,
                    "deviation": 0.0,
                    "format": "celsius",
                    "taskId": "3aabc8ea-00f1-4780-9256-817f024d0bd3",
                    "alert": false
                }
            }
        },
        {
            "type": "beacon",
            "event": {
                "id": "b32a6d08-cffc-4fd3-b1bb-06a3218a1c2c",
                "timestamp": "2024-10-25T15:38:51Z",
                "deviceId": "59b0e8c2-87c4-4109-9b4c-bead14ed1f97",
                "data": {
                    "format": "beacon",
                    "id": "DLN233301440",
                    "rssi": -46,
                    "value": "17.59"
                }
            },
            "analytics": {
                "tenant": "f9339f76a7f1143dc30f587a46e09a6e",
                "recordedTimestamp": "2024-10-25T15:39:37.618Z",
                "resourceId": "db8597cd-6176-415c-bff4-90583a77f9a6",
                "timestamp": "2024-10-25T15:38:51Z",
                "meta": {
                    "data": {
                        "taskId": "3aabc8ea-00f1-4780-9256-817f024d0bd3",
                        "task_alarm": false,
                        "notes": "",
                        "assetIds": []
                    }
                },
                "coordinates": {
                    "global": {
                        "lat": 37.522003,
                        "lng": -121.953835
                    }
                }
            },
            "decode": {
                "temperature": {
                    "sample": 17.59,
                    "deviation": 0.0,
                    "format": "celsius",
                    "taskId": "3aabc8ea-00f1-4780-9256-817f024d0bd3",
                    "alert": false
                }
            }
        }
    ]
};
   Eventdata = [];
   totalRows = objTaskEventList.results.length;
// Values Containing all relevant data for each record
 for (var j=0,idx=1;j<totalRows;j++,idx++) {
      var result = objTaskEventList.results[j];
      var Values = [
         idx,  // Sl.No
         result.event.timestamp, // Timestamp
         result.event.deviceId,   // Device ID
         result.decode.temperature.sample,  // Temperature (Sample)
         result.decode.temperature.alert    // Temperature (Alert)
      ];
      Eventdata.push(Values);
   }
   set("V[z_flag]","1");
}
SAP Process
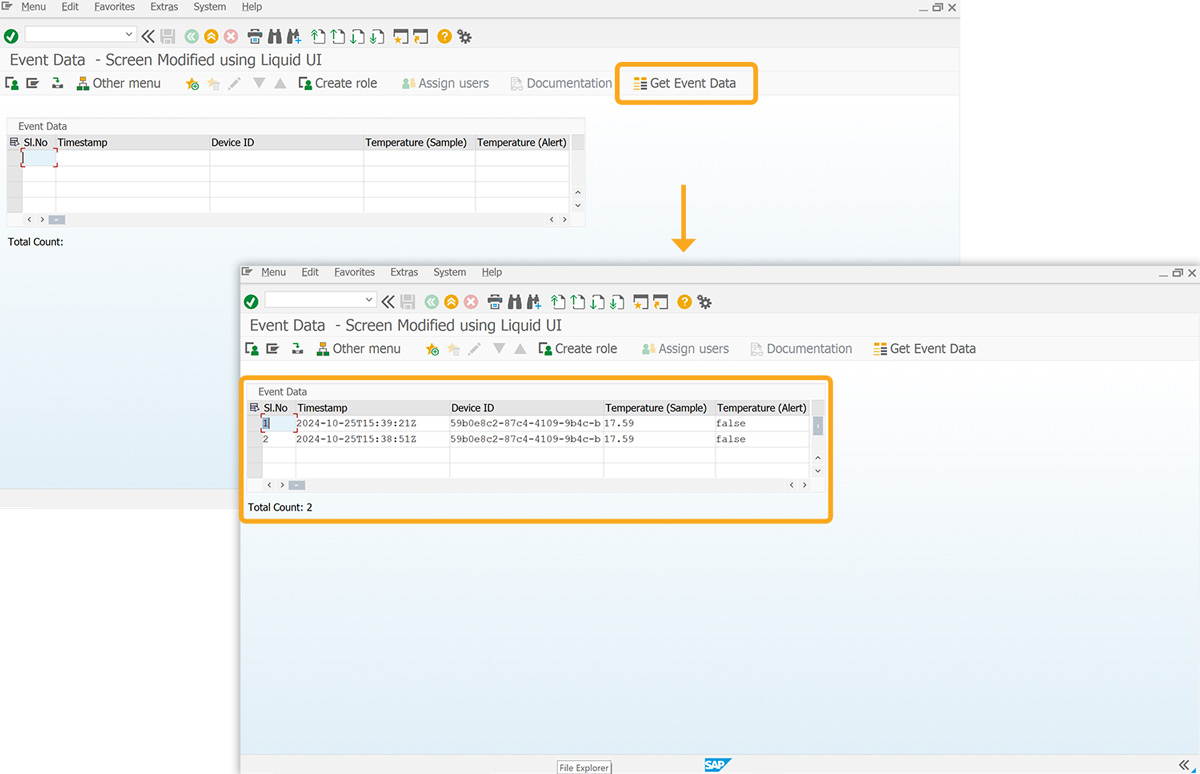
- Refresh the SAP screen and click the Get Event Data push button to display the data in the Liquid UI table along with the total count.
