Prerequisites
- Products: Liquid UI WS, Liquid UI Server or Local DLL, Client Software
- Commands: inputfield(), pushbutton(), onscreen()
Purpose
This document provides instructions on how to calculate the statistics of the process defined in a function and display the values in the input fields. To demonstrate this process, we are considering the SAP Easy Access screen as an example, and we’ll walk you through the following steps:
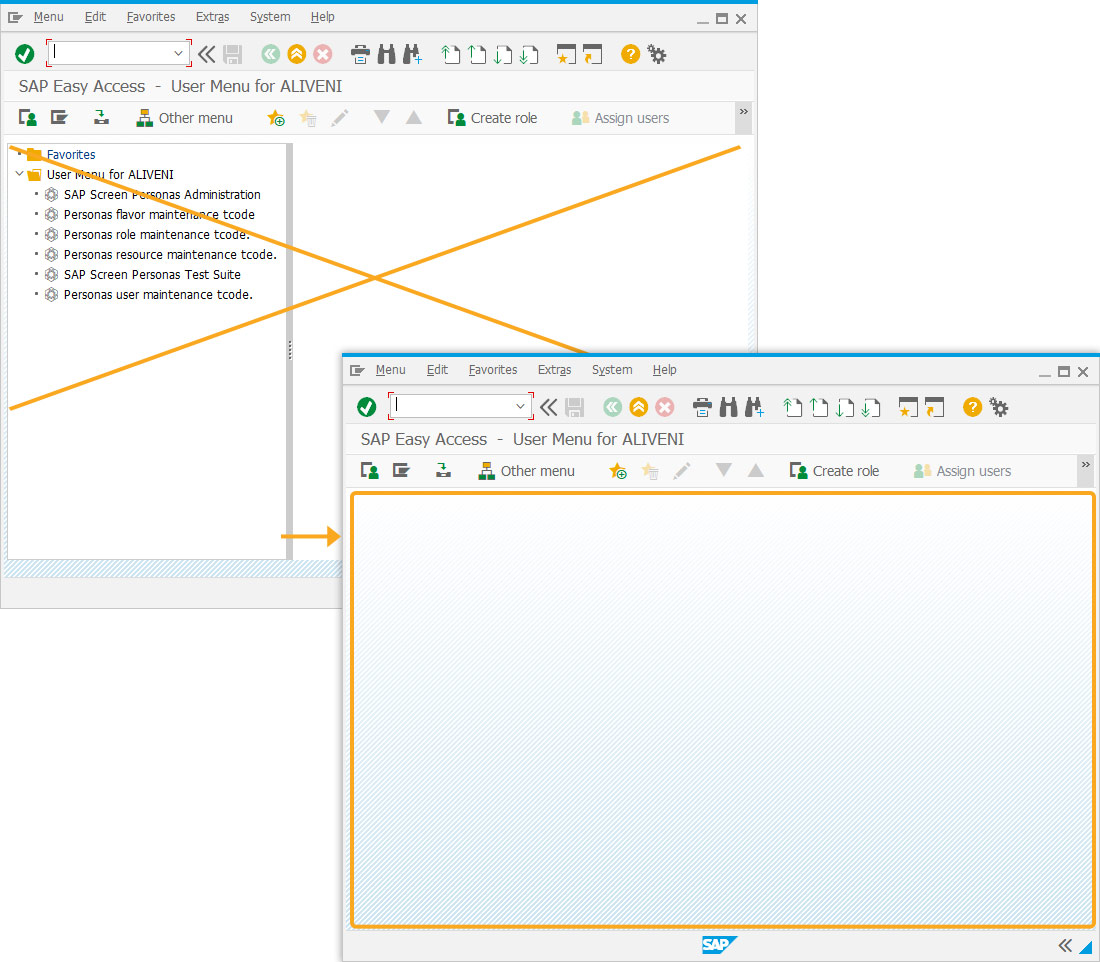
- Delete the image container on the SAP Easy Access screen
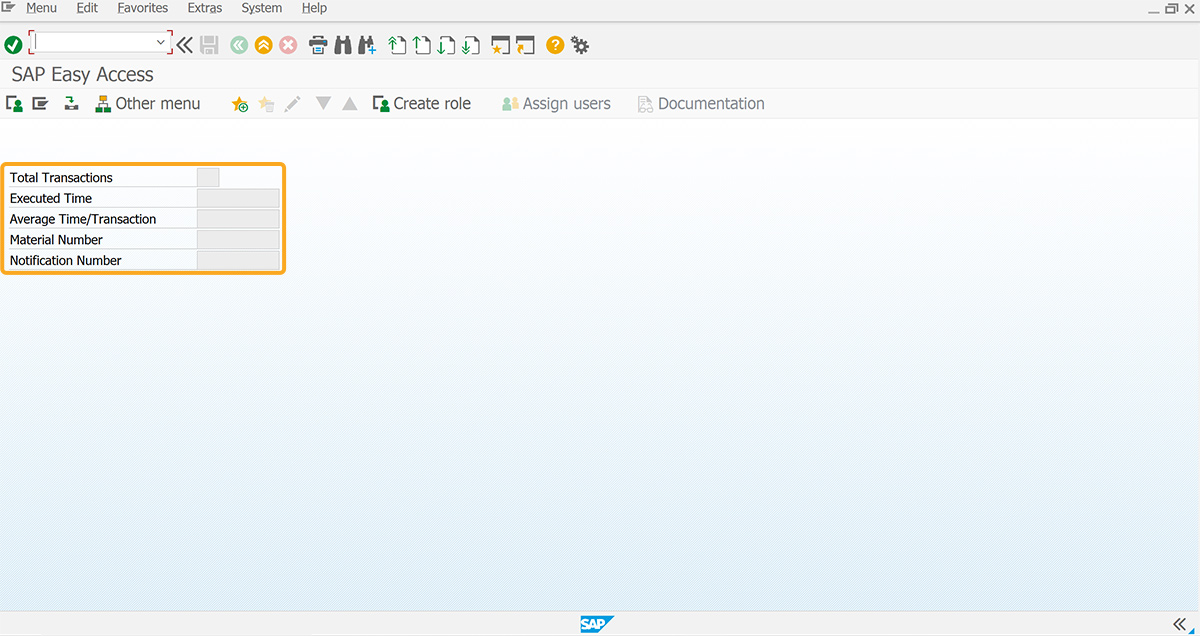
- Add input fields to display the values
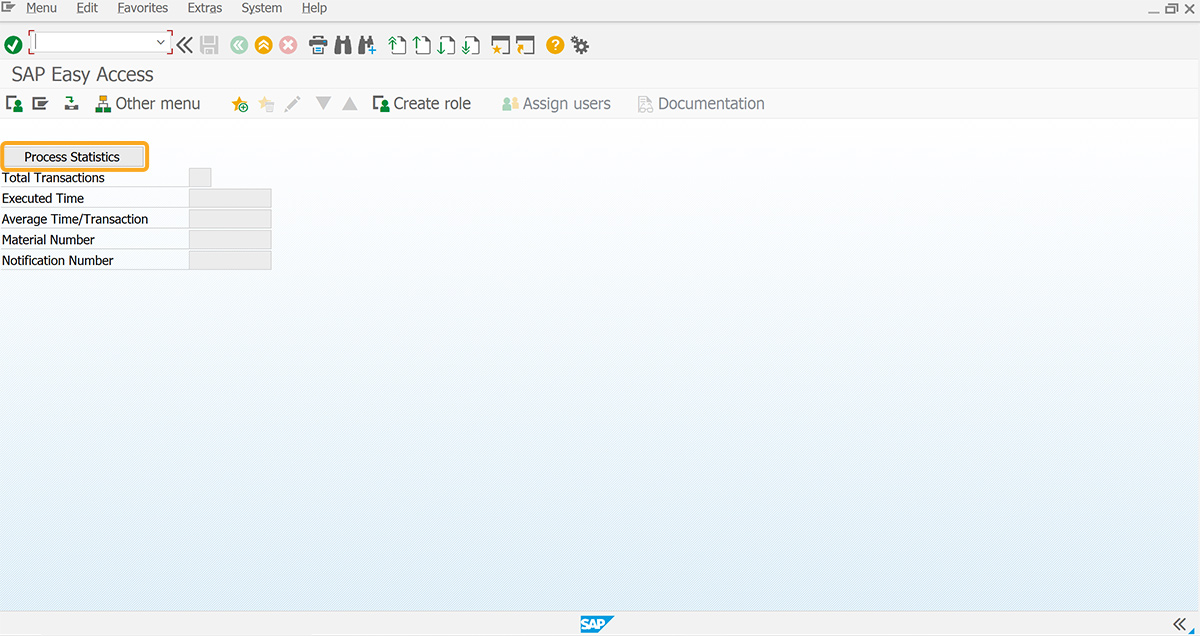
- Add push buttons to execute the function and display the value
- Add a function to convert milliseconds to either Seconds/Minutes/Hours/Days
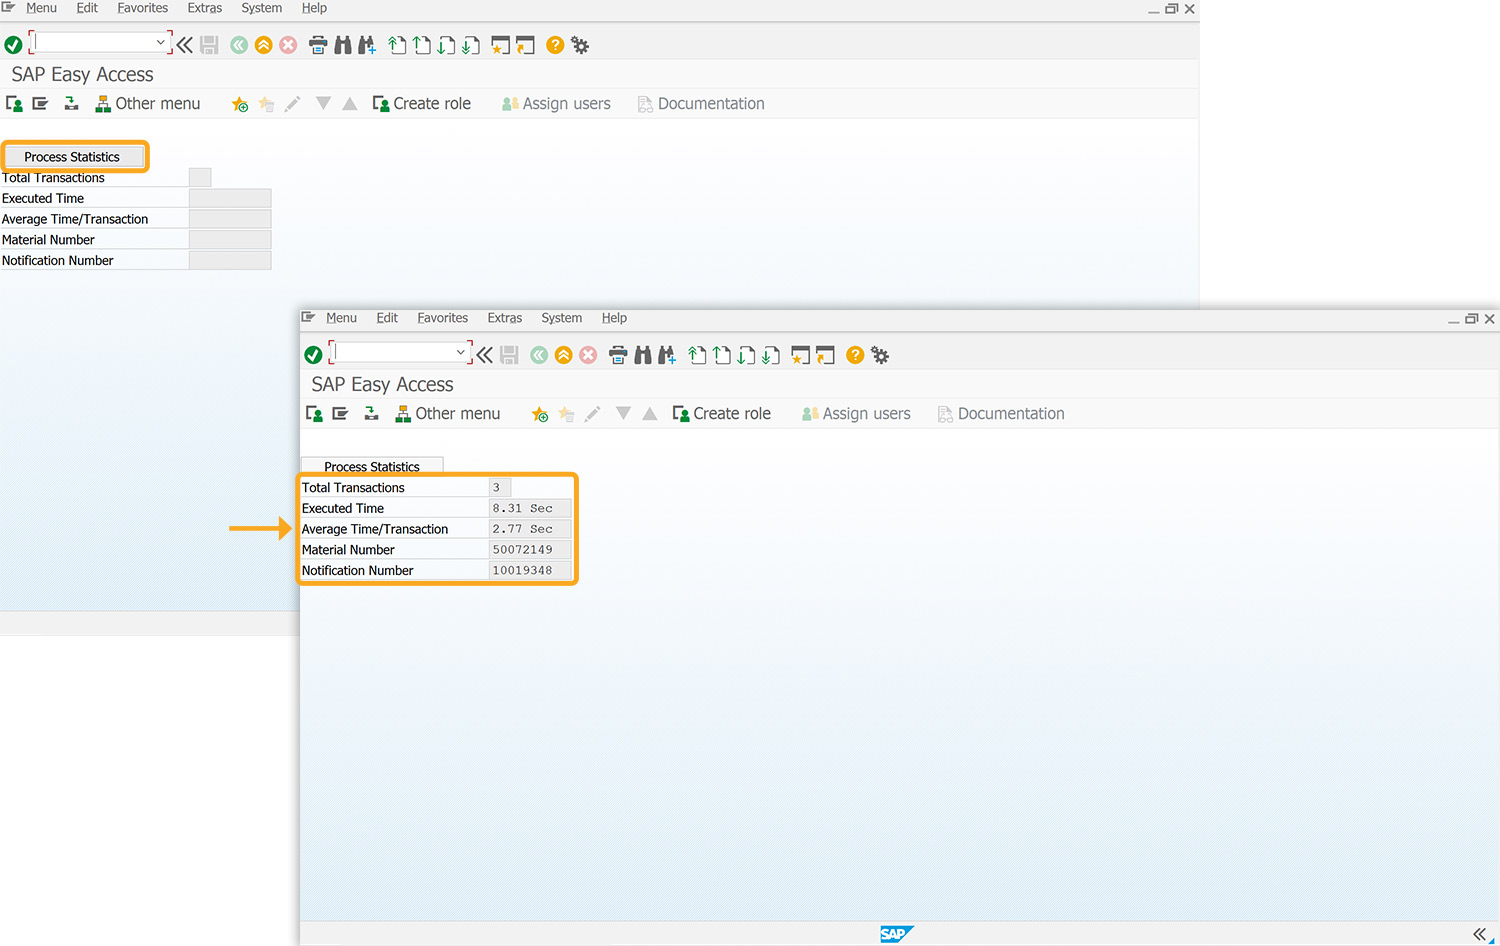
- Add a function to display process statistics defined
User Interface
//Create the file SAPLSMTR_NAVIGATION.E0100.sjs inside your scripts folder for customizing the SAP Easy Access screen
//Now, let's add the Liquid UI script to the above file and save it.
Customization
- Delete the image container on the SAP Easy Access screen using the del command.
//Deletes the image container on the SAP screen
del("X[IMAGE_CONTAINER]");

- Add five input fields labeled Total Transactions, Executed Time, Average Time/Transaction, Material Number, and Notification Number to display the total transactions worked on, the execution time of the script, and the average time taken for a transaction.
//Creates input fields to display the values
inputfield([2,0], "Total Transactions", [2,25], {"size":2, "name":"z_transactions", "readonly":true});
inputfield([3,0], "Executed Time", [3,25], {"size":10, "name":"z_executed_time", "readonly":true});
inputfield([4,0], "Average Time/Transaction", [4,25], {"size":10, "name":"z_avg_time", "readonly":true});
inputfield([5,0], "Material Number", [5,25], {"size":10, "name":"z_mm01_num", "readonly":true});
inputfield([6,0], "Notification Number", [6,25], {"size":10, "name":"z_iw21_num", "readonly":true});

- Add a push button labeled Process Statistics to calculate and display the statistics of the transactions executed.
//Creates push button to calculate and display the statistics
pushbutton([1,0], "Process Statistics", {"process":processingStatistics});

- Add a timeConversion function to convert time defined in milliseconds to Seconds/Minutes/Hours/Days.
//Function to convert milliseconds to Sec/Min/Hrs/Days function timeConversion(millisec) { var seconds = (millisec / 1000).toFixed(2); var minutes = (millisec / (1000 * 60)).toFixed(2); var hours = (millisec / (1000 * 60 * 60)).toFixed(2); var days = (millisec / (1000 * 60 * 60 * 24)).toFixed(2); if (seconds < 60) { return seconds + " Sec"; } else if (minutes < 60) { return minutes + " Min"; } else if (hours < 24) { return hours + " Hrs"; } else { return days + " Days" } } - Add processingStatistics function that navigates to various transaction screens and displays the values.
//Function to calculate Processing Statistics and displays the values in the input fields
function processingStatistics(){
    var nExecutedTransactions = 0;
    var s = new Date();

    onscreen 'SAPLSMTR_NAVIGATION.0100'
        enter('/nMM01');

    onscreen 'SAPLMGMM.0060'
        set('F[Industry sector]','M');
        set('F[Material Type]','FERT');
        enter('/5');

    onscreen 'SAPLMGMM.0070'
        enter('/19');

    onscreen 'SAPLMGMM.0070'
        set('cell[TABLE,0,1]','X');
        enter();

    onscreen 'SAPLMGMM.4004'
        set('F[MAKT-MAKTX]', 'Test 1');
        set('F[MARA-MEINS]', 'EA');
        enter('/11');

    onscreen 'SAPLMGMM.0060'
        set('V[z_mm01_num]',_message.match(/\d+/));
        nExecutedTransactions++;
        enter('/nIW21');

    onscreen 'SAPLIQS0.0100'
        set("F['Notification type]", "M1");
        enter();

    onscreen 'SAPLIQS0.7200'
        set("F[VIQMEL-QMTXT]", "'test");
        set("F[Functional loc.]", "'21-B02");
        set("F[Equipment]", "TEQ-21");
        enter('/11');

    onscreen 'SAPLIQS0.0100'
        set('V[z_iw21_num]',_message.match(/\d+/));
        nExecutedTransactions++;
        enter('/nMMBE');

    onscreen 'RMMMBESTN.1000'
        set('F[Material]','97104');
        enter('/8');

    onscreen 'RMMMBESTN.0300'
        nExecutedTransactions++;
        enter('/n');

    onscreen 'SAPLSMTR_NAVIGATION.0100'
        var e = new Date();
        var timeElapsed = e - s;
        var perTranTime = timeElapsed / nExecutedTransactions;

        set('V[z_transactions]','&V[nExecutedTransactions]');
        timeElapsed = timeConversion(timeElapsed);
        perTranTime = timeConversion(perTranTime);
        set('V[z_executed_time]','&V[timeElapsed]');
        set('V[z_avg_time]','&V[perTranTime]');
        enter('?');
}
SAP Process
- Refresh the SAP screen and click on the Process Statistics push button. Then, you will see the values displayed in the input fields, as shown below.

Next Steps

Learn how to add a time delay in a process to perform required actions.
10 min.
This article is part of the Invoking functions tutorial.

Learn how to retrieve required information from a grid screen and display them in input fields.
10 min.
This article is also a part of the Javascript functions tutorial.


